Explaining The Rise In Alternative Investments In Public Pension Plans
The brief’s key findings are:
- Since 2000, public pensions have moved more toward alternative assets like private equity and real estate, with significant variation among plans.
- To explain these patterns, the analysis explores changes in plans’ beliefs about the future returns of alternatives and their appetite for risk.
- The findings suggest a growing belief that alternatives will outperform public equities – due to consultant views, peer behavior, and plan experience in the ’90s.
- In contrast, factors related to plans’ appetite for risk play a more limited role.
Introduction
In recent decades, public pension plans in the United States have changed how they take on risk. At the turn of the century, their risky investments were primarily in public equities, whereas alternative assets – like private equity, real estate, and hedge funds – accounted for just 14 percent of all risky investments. By 2021, the share of risky assets in alternatives had grown to 39 percent. Equally interesting, the adoption of alternatives has varied enormously across plans. What has driven public pension plans to actively reallocate towards alternatives? And why have some done so much more than others?
This brief, based on a forthcoming paper, explores potential answers to these questions.1 The portfolio models used by most pensions during their asset allocation decisions point to two potential underlying factors: a change in plans’ beliefs about the future performance of alternatives, and/or a change in plans’ appetite for risk. The analysis attempts to measure the impact of these two effects by looking at factors that: 1) influence plans’ investment beliefs; and 2) motivate or constrain their risk-taking.
The discussion proceeds as follows. The first section describes the increased allocations to alternatives among public plans. The second section explores how three influences on plans’ investment beliefs – investment consultants, peers, and prior investment experience – relate to their holdings of alternatives. The third section examines the extent to which factors other than beliefs, such as structural incentives and constraints related to risk-taking, relate to holdings of alternatives. The fourth section assesses how both risk-seeking and shifting beliefs might affect the allocation to alternatives in the aggregate (rather than across plans). The final section concludes that the primary driver behind the increased allocation to alternatives is the growing belief among plan managers that alternatives will outperform public equities on a risk-adjusted basis. These beliefs are shaped by consultants, peers, and plan experience during the 1990s.
The Rise in Alternatives
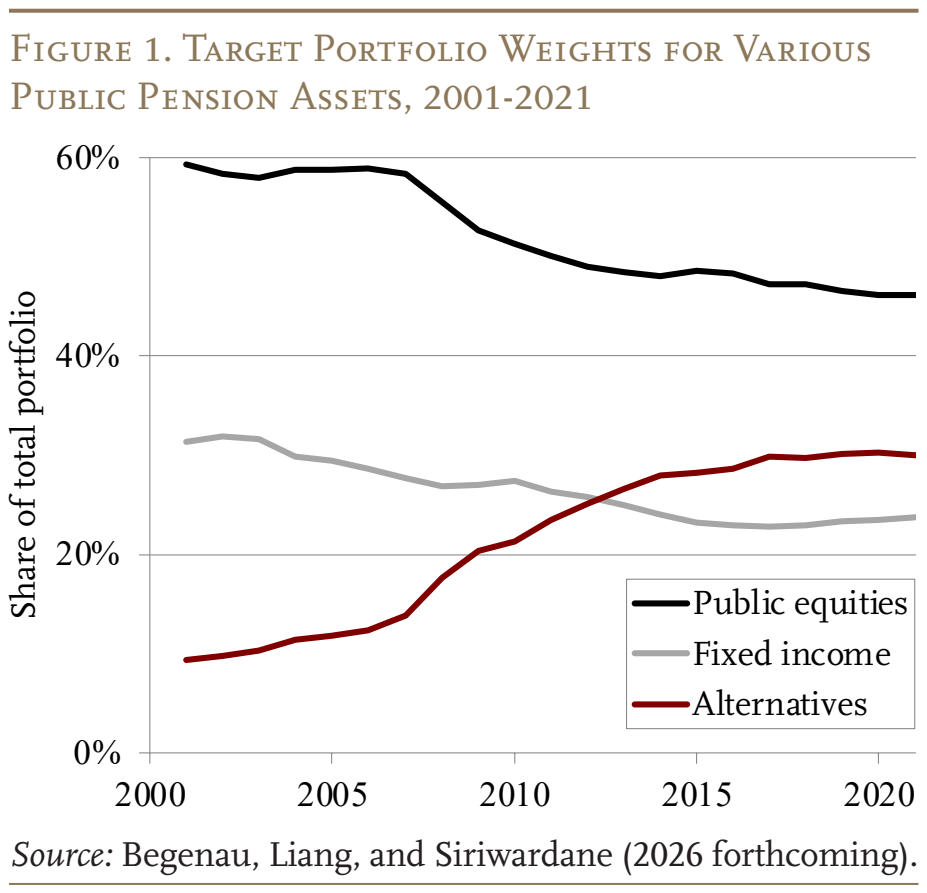
Figure 1 shows the trend in national target shares of public equities, alternatives, and fixed-income assets from the Public Plans Database (PPD).2 From 2001 to 2021, the shares in public equities and fixed-income assets both declined, while the share in alternatives increased substantially from about 10 percent to 30 percent. The overall target allocation to risky assets – defined hereafter as public equities and alternatives – rose modestly, from 69 percent in 2001 to 76 percent in 2021. Within the risky portfolio, though, alternatives steadily displaced public equities, climbing from 14 percent to 39 percent of risky assets over the last 20 years.
Figure 2 shows the evolution in alternative-to-risky shares across pension systems over time. The variation is substantial. By 2021, the gap between the 10th and 90th percentile pensions had widened to 39 percentage points (18 versus 57 percent), up sharply from 26 points in 2001. The question is what explains this variation across plans and over time. The following sections explore the role of plans’ investment beliefs and risk-seeking behaviors.
How Do Investment Beliefs Affect the Alternative-to-Risky Share?
To better understand the role that investment beliefs have played in the shifting allocation of public plans, this section explores three factors that potentially influence plan beliefs: investment consultants, peers, and prior investment experience.
Consultants’ Views
Pension investment consultants advise on everything from broad asset allocation to the selection of individual portfolio managers. As a result, a consultant’s belief about the relative performance of alternatives versus public equities is likely to shape their clients’ investment in alternatives. We refer to the expected outperformance of alternatives over public equities, after accounting for differences in risk, as “alpha.”3 Figure 3 shows that consultants have become more bullish about alternatives over time, as their expected alpha has risen by roughly 60 basis points since the early 2000s.4 A decomposition reveals that almost all of this increase is due to higher expected returns for alternatives, rather than changes in their risk or a decline in expected returns on public equities.
Interestingly, the growing optimism among consultants appears to pass through to their clients. Figure 4 plots each pension’s target alternative-to-risky share against the alpha reported by its consultant, comparing pensions within the same year. Pensions whose consultants are more bullish tend to hold higher alternative-to-risky shares.5 Importantly, this relationship appears to be driven in large part by the causal impact that consultants have on their clients, as opposed to pensions selecting consultants who already share their views. Our estimates suggest that widening disagreement among consultants about the alpha of alternatives accounts for roughly one-third of the growth in the dispersion of the alternative-to-risky share across pensions since the early 2000s.
Peer Effects
Another factor that might affect pension managers’ investment beliefs is the behavior of their peers, as suggested by recent work in household finance showing that beliefs and choices are shaped by social networks. To explore this concept in the context of public pensions, our paper defines peer networks geographically. More specifically, the target alternative-to-risky share of a plan’s peer network is defined as a weighted average of all other pensions’ target shares, where the weights are defined as the inverse of the distance between the pension and each peer.
To measure peer effects, we relate a pension’s target alternative-to-risky share to the average share of its geographic peers, controlling for pension characteristics such as funded ratio, required contributions relative to payroll, and administrative expenses relative to payroll. Because the comparison is limited to pensions that share the same consultant and region in the same year, the estimate reflects peer influence rather than shared consultant advice or common local shocks. The peer effect is sizable and statistically precise: on average, a 10-percentage-point increase in the alternative-to-risky share of a pension’s peers is associated with a 7.2-percentage-point increase in its own share. To address reverse causality, we also replace peers’ contemporaneous share with its lagged value; the estimate is similar and remains statistically significant. Together, these results suggest that peer behavior helps shape the composition of pensions’ risky investments.6
Public pensions may also take cues from institutions outside of their own sector. Figure 5 shows that the alternative-to-risky share has also increased over the same period for U.S. endowments, U.S. corporate pensions, and U.K. corporate pensions. At the same time, Figure 6 shows no such common trend in these institutions’ risky shares. These patterns are consistent with the idea that the rise of alternatives has been driven by a shift in beliefs about alpha across many types of institutional investors, rather than a broad desire to take on more risk.
Prior Investment Experience
Motivated by research on how past experiences shape beliefs, we also ask whether pensions’ experience in the public equity market during the 1990s influenced how they weighed alternatives against public equities in the decades that followed. The 1990s were a formative period for public pensions, many of which significantly increased their exposure to public equities for the first time (see Figure 7). During this time, stock markets went through a major boom-and-bust cycle that culminated in the dot-com crash of 2000-2002. Pensions that moved into equities later in the decade were more exposed to the bust without having shared in the earlier boom. Our hypothesis is that this negative experience made late entrants more bearish on public equities, leading them to raise their alternative-to-risky share more than pensions with more favorable prior exposure.
We use regression analysis to test whether late entrants to the 1990s equity boom shifted more into alternatives after the dot-com bust. The test effectively compares two pensions that increased their target public-equity share by the same total amount between 1990 and 2002, differing only in timing. One built its position in the second half of the decade (1996-2002), whereas the other entered earlier. As hypothesized, pensions that entered later – and so lived through more of the bust than the boom – saw larger increases in their alternative-to-risky share over the following two decades. Entry timing alone explains about one-fifth of the cross-state variation in changes in the alternative-to-risky share between 2002 and 2021. The relationship also holds up after controlling for financial sophistication, pension board composition, and funding levels.
The results thus far suggest that investment beliefs play a significant role in the shifting composition of plans’ risky assets. The next section will explore the role of various motives and constraints related to plans’ risk-taking.
How Does the Risk-Taking Environment Affect the Alternative-to-Risky Share?
Beyond beliefs, the most common explanation for the rise of alternatives is that pensions want to take on more risk. On its own, though, a stronger appetite for risk should lead a pension to hold more risky assets across the board, not to favor alternatives specifically. In modern portfolio theory, this logic breaks down if pensions want to take more risk but are constrained from raising their overall risky share, perhaps by statute or policy. In that case, rather than simply scale up its risky investments, a pension may tilt the composition of its risky portfolio toward alternatives.
We test this mechanism in two complementary ways. First, we ask whether the pensions that appear most constrained from taking risk are also the ones that moved most into alternatives. To gauge whether a plan is constrained, we measure whether its actual risky share is consistently above target.7 Figure 8 plots the change in each pension’s target alternative-to-risky share from 2002 to 2021 against the average gap between the pension’s actual and target risky share over the same period. The positive relationship between the two provides some indication that risk-constrained pensions have increased their alternative-to-risky share, but the strength of the relationship is weak in both economic and statistical terms. A one-standard-deviation tighter constraint is associated with only a 3-percentage point change in the alternative-to-risky share, and the measure explains just 4 percent of the variation in the shift to alternatives across pensions.
Second, we ask whether the pensions with the strongest incentives to take on risk are also the ones that moved most into alternatives. We consider several such incentives, beginning with underfunding. A common view is that a growing funding gap pushes pensions to “reach for yield” via alternatives. However, a battery of tests reveal almost no relationship between funding – in levels or changes – and alternative use or adoption. This finding holds across different measures of funding, including ones that discount pension liabilities at market rates to better capture the true size of the gap.
A related story centers on nominal return targets. Interest rates fell steadily through the 2000s. To the extent that pensions have fixed or sticky return targets, the decline in rates made those targets harder to hit, thereby creating incentives to invest in riskier, higher-yielding assets. However, the data show no such pattern. If anything, changes in a pension’s target return are negatively related to changes in its alternative-to-risky share, the opposite of what the reach-for-yield story predicts.
Another way to measure risk-seeking motives is through the age profile of pension participants. Regulators generally require underfunded pensions to amortize any unfunded accrued liabilities by making additional contributions. Pensions with more retired members have larger accrued liabilities. As a result, these pensions would have more incentive to invest in risky assets to earn higher returns and maintain their liability discount rate, which ultimately reduces the size of required contributions. Again, however, there is little evidence that pensions with the largest increases in retired members have shifted more to alternatives.
Overall, the results in this section suggest that risk-taking motives and constraints have played only a minor role in driving differences in adoption of alternatives across pensions.
How Do Changes in Beliefs and Risk-Seeking Affect Allocation in the Aggregate?
So far, the evidence points to plan beliefs as a key driver of the variation in the use of alternatives across pensions, with risk-seeking motives and constraints playing a more limited role. But our proxies for risk appetite are imperfect, so their weak explanatory power may understate how much risk-seeking actually matters.8 Our analysis has also focused on the cross-section of pensions, with less to say about what has driven the aggregate shift toward alternatives. To address both issues, we build a model of optimal asset allocation based on the mean-variance approach used by most U.S. public pensions.9
For simplicity, the model includes three assets (fixed income, public equities, and alternatives). We use it to gauge how a rise in risk-seeking, modeled as a decline in a pension’s risk aversion, would affect the alternative-to-risky share. The simulation proceeds as follows. We first draw many different sets of beliefs about the risk and return of each asset class as of 2001, leaving the perceived volatility of alternatives as a free parameter. For each draw, we then pin down two quantities: 1) the volatility of alternatives that makes the model’s optimal alternative-to-risky share equal its observed 2001 value; and 2) the level of risk aversion that makes the model match the observed risky share in 2001. With each scenario calibrated to 2001, we then ask whether a decline in risk aversion can reproduce the actual rise in the alternative-to-risky share from 2001 to 2021. To simulate a binding risk constraint, we assume that pensions are restricted from increasing their risky share above their 2021 level.
The headline result is striking. In over 99 percent of scenarios, no change in risk aversion can account for the observed increase in the alternative-to-risky share, so long as beliefs are held fixed. The intuition for this finding is straightforward. In 2001, public equities made up most of the risky portfolio, which by revealed preference means pensions viewed them more favorably than alternatives. In nearly every scenario, then, public equities have a higher expected return than alternatives in 2001, so a pension seeking more risk would tilt even further toward public equities, not alternatives. In short, the increase in the alternative-to-risky share simply could not have happened without a concurrent shift in beliefs.
The model can also tell us how much beliefs about the alpha of alternatives relative to public equities would need to change to explain the aggregate trend.10 On average across scenarios, plans’ perceived alpha on alternatives would have to rise by about 70 basis points. Consultants grew more bullish over this period (their reported alpha rose by roughly 60 basis points), but our causal estimates imply that only about 12 percent of the required shift can be attributed to them. The rest reflects beliefs that plans form on their own. Of that independently formed portion, our peer-effects estimates suggest that amplification through peer networks accounts for about 20 percent.
These results reinforce the earlier cross-sectional findings that risk-seeking plays only a minor role in the rising alternative-to-risky share. However, this does not rule out that U.S. public pensions are reaching for yield or facing binding risk constraints. In fact, the rise in the overall risky share (public equities plus alternatives) is clear evidence that pension risk aversion has indeed declined. But our analysis shows that neither channel can sufficiently explain the increase in the alternative-to-risky share without a concurrent shift in beliefs.
Conclusion
Since the early 2000s, U.S. public pensions have altered the composition of their risky investments, actively reallocating away from public equities and into alternatives like private equity, real estate, and hedge funds. Our findings support a simple explanation for this trend: a growing belief among pension plans that alternatives will outperform public equities on a risk-adjusted basis. These beliefs, in turn, are shaped by consultants, peers (which include private, as well as public, pension plans and institutions), and plan experience during the 1990s. Other factors, including risk-seeking motives, spending needs, and governance play a more limited role.
A natural question that emerges from our analysis is whether pension and consultant beliefs about alpha are rational. This question is difficult to answer definitively given the inherent challenge of measuring the alpha of alternative investments, especially illiquid ones.11 On the one hand, consultant beliefs are not wildly out of line with estimates from historical data or the academic literature. On the other hand, pensions with high alternative-to-risky shares do not clearly outperform those with lower shares, either within their alternatives portfolios or at the overall system level, as one might expect under fully rational expectations.12 Our own preliminary step toward addressing this question – described in a separate Appendix to our full paper – found mixed evidence, at best, that does not permit strong conclusions.13 Thus, our main takeaway is that more work is needed to assess whether beliefs about alpha are rational. This question is critical for assessing the welfare implications of alternatives for pension beneficiaries, especially given the costs and complexity of investing in this asset class.
References
Aubry, Jean-Pierre and Yimeng Yin. 2024. “How Do Public Pension Plan Returns Compare to Simple Index Investing?” Issue in Brief 24-13. Chestnut Hill, MA: Center for Retirement Research at Boston College.
Begenau, Juliane, Pauline Liang, and Emil Siriwardane. 2026 (forthcoming). “The Rise of Alternatives.” The Review of Financial Studies.
Brown, Gregory, Christian Lundblad, and William Volckmann. 2025. “Risk-adjusted Performance of Private Funds: What Do We Know?” White Paper. Chapel Hill, NC: University of North Carolina, Institute for Private Capital.
Campbell, John Y. 2018. Financial Decisions and Markets: A Course in Asset Pricing. Princeton, NJ: Princeton University Press.
Gupta, Arpit and Stijn Van Nieuwerburgh. 2021. “Valuing Private Equity Investments Strip by Strip.” The Journal of Finance 76(6): 3255-3307.
Korteweg, A. 2023. “Risk and Return in Private Equity.” In Private Equity and Entrepreneurial Finance, Volume 1 of Handbook of the Economics of Corporate Finance, edited by B. E. Eckbo, G. M. Phillips, and M. Sorensen, 343-418. Amsterdam, Netherlands: North-Holland Publishing Company.
Public Plans Database. 2025. Center for Retirement Research at Boston College, MissionSquare Research Institute, National Association of State Retirement Administrators, and the Government Finance Officers Association.
Endnotes
- Begenau, Liang, and Siriwardane (2026 forthcoming). ︎
- The PPD is maintained by the Center for Retirement Research at Boston College and currently includes data from 2001 to 2025. The analysis is based on target portfolio weights to focus on active portfolio choices. When target shares are missing, the analysis uses actual shares.
 ︎
︎ - More precisely, alpha is defined as the expected return on alternatives in excess of what their exposure to public equities would predict. A positive alpha means alternatives are expected to outperform public equities even after accounting for how the two move together. ︎
- For each consultant-year in our sample, we compute the alpha for private equity, real estate, and hedge funds separately and then calculate an equal-weighted average to serve as the “alpha” for alternatives. This approach ensures that variation in alpha across plans is driven entirely by variation in the alpha of the different asset classes, rather than shifts in a plan’s composition of alternative assets. To maintain a relatively consistent panel, the exercise included only consultants with at least 10 years of data. The time series begins in 2003, the first year in which beliefs about all three asset classes are available for multiple consultants. ︎
- This correlation is statistically significant, even after accounting for funding status, size, asset return targets, and several other pension characteristics. ︎
- The analysis also asks whether these peer effects reflect learning from peers or herding incentives (e.g., pensions following their peers to avoid criticism for contrarian choices). To separate the two, we re-estimate peer effects among plans with weaker incentives to herd: those with longer-tenured CIOs, stronger funding, and higher recent returns. Peer effects remain economically and statistically meaningful for these subgroups, suggesting that the peer effects primarily reflect learning from peers rather than herding. ︎
- The idea is as follows. Market fluctuations will naturally move each pension’s actual risky share from its target, after which pensions must rebalance to bring the two back in line. If a pension plan wants to increase its risky share beyond its target, but is constrained from doing so, that pension will rebalance quickly when its actual risky share falls below target. Conversely, that same plan should be slower to rebalance when its actual risky share is above target because it prefers to take on the extra risk. Under this logic, a persistent overallocation relative to target is indicative of binding constraint. ︎
- For example, funding may not perfectly capture a pension’s effective risk aversion because the link between legally mandated contributions and underfunding may vary at the state or local level. Pension regulation is another potential confounding factor. In the late 1980s and 1990s, many state and local legislatures lifted restrictions on the ability of pensions to take risk, thereby decreasing the effective risk aversion of pensions in aggregate and potentially driving the rise in the alternative-to-risky share during the 2000s. ︎
- Prior research has established that public pensions typically establish target portfolio shares through comprehensive asset-liability studies and mean-variance analysis (Campbell 2018). Based on our own review of the top 100 largest pensions by size, 85 mention mean-variance analysis in their CAFRs, asset-liability studies, or other documents available on their websites. ︎
- This analysis assumes plans are unconstrained in their overall risky share. Within each simulation, we solve for the increase in perceived alpha of alternatives that is needed to match the observed alternative-to-risky share in 2021. We then solve for the required risk aversion needed to match the aggregate risky share in 2021. After allowing for shifts in beliefs, only small changes in risk aversion are needed to match the observed increase in the aggregate risky share. ︎
- See, for example, Gupta and Van Nieuwerburgh (2021); Korteweg (2023); and Brown, Lundblad, and Volckmann (2025). ︎
- For example, Aubry and Yin (2024) compare the performance of a simple 60/40 index fund (with no alternative investments) to actual public pension portfolios over the past two decades and find virtually identical returns for these two strategies. ︎
- See Appendix E.3. in the online supplement to Begenau, Liang, and Siriwardane (2026 forthcoming). ︎
Popular Products
-
 Electric Toothbrush & Water Flosser S...
$43.56$21.78 -
 Foldable Car Trunk Multi-Compartment ...
$329.56$164.78 -
 Mommy Diaper Backpack with Stroller O...
$111.56$55.78 -
 Ai Dash Cam with Front & Rear HD, GPS...
$295.56$147.78 -
 Smart Auto-Recharge Robot Vacuum Cleaner
$613.56$306.78