Medicare Finances: A Perspective On The 2026 Trustees Report
The brief’s key findings are:
- Medicare gets too little attention, and the limited coverage focuses on the depletion of the Hospital Insurance trust fund – a tiny portion of the problem.
- The real challenge is Medicare’s total costs, which will soon outpace Social Security, and could be higher still if current spending constraints are eased.
- The major problem is that Medicare operates within the very expensive U.S. healthcare system, which costs twice as much as that in other countries.
- In addition, Medicare Advantage plans, which cover more than half of beneficiaries, cost 14 percent more per person than traditional Medicare.
- Controlling Medicare costs requires fixing the nation’s healthcare system, but reining in Medicare Advantage should also be high on the immediate agenda.
Introduction
Medicare receives too little attention. While the Trustees’ Report on Social Security makes headlines, commentary on Medicare is relegated to the back pages. Yet Medicare is a huge and growing program, operating in an expensive environment. In 11 years, the country is slated to pay more for Medicare than Social Security.
And when commentators do acknowledge Medicare, they focus on the wrong problem. What captures their attention is the exhaustion date of the Hospital Insurance (HI) trust fund. But HI is only 37 percent of Medicare expenditures today and is projected to decline further, and the HI shortfall is relatively small.
The challenge is not that Medicare is running out of money, but that it is drawing on too much of the nation’s resources. More concerning, the Trustees’ projections most likely underestimate future costs. The program’s actuaries are concerned that Medicare’s current-law controls on reimbursements to hospitals and doctors may be unrealistic, and costs could be substantially higher. This brief summarizes the current state of Medicare’s finances and takes a quick look at some of the underlying issues.
The discussion proceeds as follows. The first section provides an overview of the Medicare program. The second section describes the 2026 Trustees Report projections that use current-law assumptions. The third section compares the current-law projections to an alternative scenario prepared by Medicare’s Office of the Actuary. The fourth section explores why Medicare expenditures are slated to outpace Social Security, focusing on both the cost of U.S. healthcare and the growth of Medicare Advantage. The final section concludes that Medicare deserves to rise to the top of the nation’s policy agenda.
An Overview of Medicare
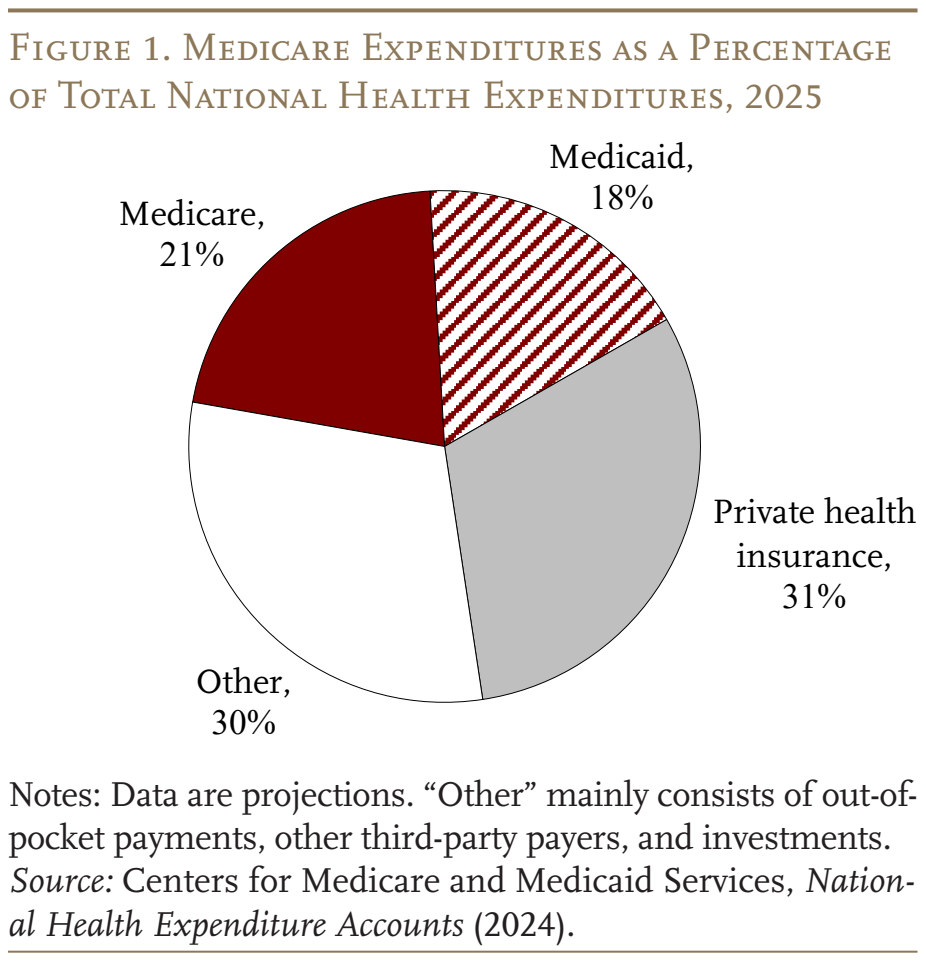
Medicare is the largest public health program in the United States. It covers virtually all people ages 65+ and those who receive federal disability insurance benefits. As shown in Figures 1 and 2, the program accounts for 21 percent of national healthcare spending and 14 percent of the federal budget.
Traditional Medicare has two components (see Table 1). The first – Part A, Hospital Insurance (HI) – covers inpatient hospital services, skilled nursing facilities, home healthcare, and hospice care. The second – Supplementary Medical Insurance (SMI) – consists of two separate accounts: Part B, which covers physician and outpatient hospital services, and Part D, which was enacted in 2003 and covers prescription drugs. The arrangements are more complicated because Medicare also includes Part C – the Medicare Advantage plan option, which makes payments to private insurance plans that provide both Part A and Part B as required, and often Part D as well. Medicare Advantage now accounts for almost half of total outlays (see Table 1).
The Medicare program has two trust funds, each with its own source of revenues. Part A (HI) gets most of its revenue from a 2.9-percent payroll tax, shared equally by employers and employees. In addition, high earners pay a 0.9-percent tax on their wages above a threshold of $200,000 for singles ($250,000 for couples). Since these thresholds are not indexed for wage growth or inflation, an increasing share of workers and their earnings will become subject to the higher HI tax rate.1 Overall, payroll taxes accounted for 87 percent of Part A revenue in 2025 (see Table 2). Most of the remaining revenue comes from a portion of federal income taxes that Social Security recipients pay on their benefits.
The SMI trust fund contains the revenues for Parts B and D. Part B is financed primarily by government general revenues (73 percent), augmented by participant premiums (26 percent). Part D, which covers outpatient prescription drugs, is even more reliant on general revenues (81 percent), with a little money from beneficiary premiums (8 percent).2
The Medicare Trustees issue an annual report projecting the program’s finances over the next 75 years under current law. In the wake of the Affordable Care Act of 2010 (ACA), the Trustees have assumed a substantial reduction in the growth rate of per-capita health expenditures relative to historical experience, due to the ACA limitations on hospital and physician reimbursement rates. Concerned that inadequate reimbursement rates could lead hospitals and doctors to stop serving Medicare patients, the actuaries prepare an alternative set of projections that relaxes the ACA limitations. The next section discusses the official outlook for Medicare finances, and the following section describes the actuaries’ alternative scenario.
Medicare Finances under Current Law
This discussion of 75-year financial projections proceeds in alphabetical order – Part A, then Parts B and D, but this pattern does not reflect the severity of the financial challenge. While Part A, the HI program, garners the most press attention because it has a depleting trust fund, it relies on well-defined and dedicated revenues. It is also declining in importance, reflecting a shift from inpatient to outpatient services (see Figure 3). Attention should be focused on Part B, which is growing and places enormous pressure on general revenues and the beneficiary.
The Outlook for HI – Part A
The best summary of HI finances is the average deficit over the next 75 years (see Figure 4). The effect of the ACA is evident as 75-year deficits declined from over 3 percent of taxable payroll before the legislation in 2010 to generally under 1 percent in the last 15 years. In 2026, the 75-year deficit is 0.56 percent of taxable payroll, only a tad higher than the 0.42 percent in last year’s Report. The slight increase in the deficit in 2026 reflects a projected decline in HI revenues due to lower taxation of Social Security benefits resulting from the One Big Beautiful Bill Act (OBBBA). The previous projections for HI revenues were based on the assumption that the 2017 tax cuts expired at the end of 2025, but the OBBBA extended the tax cuts. As a result, seniors pay lower-than-projected rates on their income, including their Social Security benefits. The 75-year deficit could be eliminated by raising the HI payroll tax rate from 2.9 to 3.46 – a 0.28-percentage-point increase for the employee and employer.
The HI program is projected to run a small surplus through 2026, after which it will have to draw down reserves from the HI trust fund to bridge the gap between scheduled costs and revenues. By the second quarter of 2033, the Trustees project that reserves in the HI trust fund will be depleted. The exhaustion of the trust fund has moved up by one quarter since last year due to the OBBBA. As is the case with Social Security, Medicare’s HI component can pay health plans and providers only to the extent allowed by ongoing tax revenues. Revenues will be sufficient to cover only 89 percent of program costs in 2033 and 87 percent in 2034.
The Outlook for SMI – Parts B and D
Parts B and D fall under the SMI trust fund. Each part has its own separate account, and money cannot flow between the two programs. Compared with projections in last year’s Report, both Part B and Part D expenditures are higher as a share of GDP. The Part B difference is due primarily to faster projected growth over the long run for Part B drugs. For Part D, the long-run pattern results from higher costs in 2025 due to increases in the use of GLP-1 and expensive specialty drugs.
Despite higher costs, the SMI trust fund has adequate revenues throughout the projection period to cover the cost of Parts B and D, because the law provides for general revenues and participant premiums to meet each year’s expected costs. The problem is that costs are high and rising (see Figure 5), claiming massive amounts of general revenues and burdening beneficiaries with rapidly increasing premiums.
The Outlook for Total Medicare Spending
As required by law, the Trustees issued a funding warning once again in 2026. This warning is required when the difference between Medicare’s total expenditures and its dedicated financing sources is projected to exceed 45 percent of expenditures.3 In response, the President is supposed to propose legislation to address the problem, and Congress is supposed to consider the legislation on an expedited basis. This is the 10th consecutive year that the Trustees have warned that Medicare is excessively relying on general revenues, and no action has been taken.
More concerning, the warning is based on the Trustees’ current-law projections, which include the cost-control provisions in the ACA and subsequent legislation.4 The risk is that these provisions will produce inadequate reimbursement rates, which could lead hospitals and doctors to stop serving Medicare patients. Therefore, the actuaries offer an alternative set of projections.
Actuaries’ Projections under Alternative Assumptions
The actuaries begin by documenting the deteriorating relationship between Medicare payments for services and private health insurance payments for the same services. By 2025, Medicare prices for hospital services had declined to 55 percent of those covered by private insurance, and for physician services to 64 percent (see Figure 6). If this percentage continues to decline, doctors and hospitals may pull back from providing care for Medicare beneficiaries. In response, Congress may find it necessary to revise the calculation of Medicare reimbursements. The actuaries offer a set of projections based on alternative assumptions for updating the amounts that Medicare can pay to hospitals and physicians.5
Productivity Adjustments. The payments for services covered by Medicare require annual increases to reflect the rising costs for wages, equipment, and overhead expenses, such as heating, utilities, and rent. To create strong incentives for healthcare providers to improve efficiency, the ACA reduced the annual increases by the percentage increase in economy-wide productivity. The problem is that health services are very labor-intensive, so productivity gains in this sector are likely to be much smaller than those in other parts of the economy, and subtracting economy-wide productivity will lead to inadequate increases. The alternative scenario assumes that, between 2028 and 2042, the economy-wide productivity adjustment will gradually phase down until annual Medicare price updates equal those assumed for private plans.
Physician Payments. Cost-saving restrictions also sharply limit the annual payment updates for physicians. The alternative scenario assumes that the increases in physician payments will gradually transition, over the period 2028-2042, from current law to the growth in the Medicare Expenditure Index.
With these relaxations of cost-saving provisions in current law, expenditures under Parts A and B increase noticeably as a percentage of GDP. (Part D costs were not affected by legislated cost controls.) By 2100, the total cost of Medicare is 2.3 percent of GDP higher under the alternative than under the current-law provisions (9.8 percent versus 7.5 percent).
After 17 years of Trustees’ and alternative projections, an interesting question is whether they are converging or diverging over time. As shown in Figure 7, the current-law projections have remained within a relatively narrow band, with the 2026 projections at the top of the range. In contrast, the alternative projections have declined noticeably, with 2026 in the middle of the pack. Thus, the two sets of estimates have converged substantially, and the expenditure gap appears to have stabilized at roughly 2 percent of GDP.
The bottom line is that the cost of Medicare is alarming under current law, and the picture looks meaningfully worse under the actuaries’ alternative projections. The following takes a quick look at what Medicare means for government spending and what can be done.
An Expensive Program
While Social Security gets all the attention, Medicare expenditures are increasing much more rapidly. In contrast to Social Security, where population aging can explain all the growth in expenditures over the next 30 years, an aging population explains much less than half of projected future growth in Medicare (see Figure 8). The rest comes from the costs for hospital and physician services rising faster than GDP.
With Medicare growing so quickly, its outlays will surpass Social Security expenditures in 11 years (see Figure 9). And by 2100, the end of the projection period, Social Security accounts for 6.7 percent of GDP, while, as noted, Medicare equals 7.5 percent under the Trustees’ current-law assumptions and 9.8 percent under the actuaries’ alternative projections. It should be at the top of everybody’s worry list.
Market Factors
The fact that Medicare is so expensive does not mean that the program is excessively generous. In fact, traditional Medicare coverage is less comprehensive than most private sector plans. For example, Medicare provides only limited mental health benefits and does not place an upper bound on cost-sharing responsibilities for hospital stays, skilled nursing facility care, or physician costs.
The better explanation for why Medicare’s costs are so high is that it operates in an expensive environment. U.S. healthcare costs as a percentage of GDP are the highest in the developed world and almost twice as high as the average of all the other countries in the Organisation for Economic Co-operation and Development (OECD) (see Figure 10). Differences in U.S. health costs are driven by relatively high salaries for doctors, high drug prices, and high administrative costs, not higher utilization of healthcare.6 These broader market pressures make Medicare an expensive program.
Sadly, Americans do not appear to be getting much for their money. The U.S. is one of the few countries that does not offer universal coverage for its non-aged population; its life expectancy at birth is well below the OECD average; and its infant mortality rate is higher. Surprisingly, even life expectancy at 65, an age when virtually everyone gains coverage by Medicare, falls short of the OECD average. Certainly, the U.S. has a very diverse population, so a large number of very low-income families could explain part of the poor outcomes. But the U.S. needs a more effective and efficient national healthcare system both to achieve better outcomes overall and to constrain future costs in Medicare.
Yet not all of Medicare’s high costs are due to operating in a high-cost environment; some of the problem is embedded in the design of the program – namely, the cost of Medicare Advantage.
The High Cost of Medicare Advantage
Increasingly, Medicare participants receive their benefits through a Medicare Advantage plan offered by a private insurer rather than through government-run traditional Medicare (see Figure 11).7
Medicare Advantage plans must provide all benefits covered under Parts A and B, and most cover Part D benefits as well. Three factors, however, make Medicare Advantage plans particularly attractive to beneficiaries: 1) enhanced benefits, such as dental, vision, hearing, and fitness; 2) a limit on annual out-of-pocket costs for Parts A and B services (unlike traditional Medicare); and 3) low or zero premiums. In return, enrollees must accept the plans’ procedures, such as prior authorization for accessing care, and more limited networks of healthcare providers. On balance, however, it’s clear why older people often opt for Medicare Advantage plans.
While Medicare usually pays for services that participants actually receive, the program pays Medicare Advantage plans a fixed amount per enrollee. That amount is tied to local benchmarks that reflect per capita expenditures in traditional Medicare and reflect the plan’s estimated costs of providing Parts A and B benefits to its enrollees. Payments are risk-adjusted to reflect the health status of each plan’s enrollees. Plans with higher ratings also receive higher payments.
Congress’s Medicare Payment Advisory Commission estimates that payments for Medicare Advantage beneficiaries in 2026 were 14 percent higher than for traditional Medicare.8 These overpayments arise for three main reasons. First, Medicare Advantage plans record more health conditions than traditional Medicare for comparable beneficiaries. Second, while Medicare Advantage enrollees are distinctly healthier than those in traditional Medicare, plans fail to account for favorable selection.9 Finally, the quality bonus program further increases payments to Medicare Advantage plans relative to traditional Medicare. While the federal government has taken some steps to rein in the costs of Medicare Advantage plans, efforts to date have not gone far enough to solve the problem.10
The bottom line is that the shift away from traditional Medicare to Medicare Advantage is raising the cost of a program that is already operating in a high-cost environment.
Conclusion
While commentators fixate on the exhaustion date of the HI trust fund, the real message from the Trustees’ Report – year after year – is that Medicare costs taxpayers and beneficiaries a lot of money. And if the constraints on reimbursements to hospitals and physicians prevent Medicare beneficiaries from accessing care, and Congress reacts by relaxing the constraints, costs will be even higher than the Trustees project.
The major problem is that the U.S. healthcare system is twice as expensive as systems in other countries, and so a fix requires redesigning the nation’s whole approach to the provision of healthcare. In the short term, however, reducing these overpayments for Medicare Advantage should be high on the agenda.
References
Catlett, Kierstin, Nathan Smith, Megan S. Jarvis, Jane Sullivan, Caroline Goldzweig, and Susan Dentzer. 2025. “Health Outcomes Under Full-Risk Medicare Advantage vs Traditional Medicare.” The American Journal of Managed Care 31(10): 294-301.
Centers for Medicare & Medicaid Services. 2000-2026. Annual Report of the Boards of Trustees of the Federal Hospital Insurance and Federal Supplementary Medical Insurance Trust Funds. Washington, DC: U.S. Department of Health and Human Services.
Centers for Medicare & Medicaid Services. 2024. National Health Expenditure Accounts. Washington, DC: U.S. Department of Health and Human Services.
Congressional Budget Office. 2026a. “Historical Budget Data.” Washington, DC.
Congressional Budget Office. 2026b. “The Budget and Economic Outlook: 2026 to 2036.” Washington, DC.
Congressional Budget Office. 2026c. “Baseline Projections for Selected Programs.” Washington, DC.
Medicare Payment Advisory Commission. 2026. “The Medicare Advantage Program: Status Report.” Washington, DC.
Organisation for Economic Cooperation and Development (OECD). 2024. “OECD Indicators: Health Spending (% of GDP).” Paris, France.
Shatto, John D. and M. Kent Clemens. 2010-2026. “Projected Medicare Expenditures under an Illustrative Scenario with Alternative Payment Updates to Medicare Providers.” Washington, DC: U.S. Department of Health and Human Services.
Tevis, Delaney, Matt McGough, Juliette Cubanski, Matthew Rae, and Cynthia Cox. 2025. “How Do Healthcare Prices and Utilization in the United States Compare to Peer Nations?” Peterson-KFF Health System Tracker.
U.S. Social Security Administration. 2026. The Annual Reports of the Board of Trustees of the Federal Old-Age and Survivors Insurance and Federal Disability Insurance Trust Funds. Washington, DC: U.S. Government Printing Office.
Van de Water, Paul. 2025. “Growth in Medicare Advantage Raises Concerns.” Washington, DC: Center for Budget and Policy Priorities.
Endnotes
- By the end of the long-range projection period, an estimated 80 percent of workers would be subject to this additional tax. Thus, HI payroll tax revenues will increase steadily as a percentage of taxable payroll. ︎
- An additional 10 percent comes from state payments for beneficiaries enrolled in both Medicare and Medicaid. For these “dually eligible” individuals, state Medicaid programs cover Medicare cost-sharing obligations in order to reduce the financial burden on low-income older adults and people with disabilities.
 ︎
︎ - Dedicated financing sources consist of HI payroll taxes, the HI share of income taxes on Social Security benefits, Part D state payments, Part B drug fees, and beneficiary premiums. ︎
- The ACA, passed in 2010, contained roughly 165 provisions aimed at reducing costs, increasing revenues, eliminating fraud and waste, and developing research and technological enhancements. Subsequently, the Medicare Access and CHIP Reauthorization Act of 2015 (MACRA) revised the system for paying physicians. ︎
- The actuaries note that the use of an alternative scenario for analysis should not be construed as an endorsement by the Trustees, the Centers for Medicare & Medicaid Services, or the actuaries themselves. ︎
- See Tevis et al. (2025). ︎
- For a good summary, see Van de Water (2025). ︎
- Medicare Payment Advisory Commission (2026). ︎
- Catlett et al. (2025). ︎
- Medicare Payment Advisory Commission (2026). ︎
Popular Products
-
 Enamel Heart Pendant Necklace
$49.56$24.78 -
 Digital Electronic Smart Door Lock wi...
$211.78$105.89 -
 Automotive CRP123X OBD2 Scanner Tool
$649.56$324.78 -
 Portable USB Rechargeable Hand Warmer...
$61.56$30.78 -
 Portable Car Jump Starter Booster - 2...
$425.56$212.78