Social Security’s Financial Outlook: The 2026 Update In Perspective
The brief’s key findings are:
- The 2026 Trustees Report takes a major step towards offering a more realistic picture of Social Security’s financial status.
- The advancement involves a long-overdue recognition that fertility will not rebound and that less immigration and the OBBBA will mean less revenue.
- Unfortunately, the Trustees’ “offsetting” assumptions on productivity and mortality are unpersuasive and mask the full impact of the changes.
- In any case, the reforms required to fix Social Security are doable. All that is needed is the political will.
Introduction
This year’s Social Security Trustees Report has taken a major step towards offering a more realistic assessment of Social Security’s financial status. Unfortunately, the Trustees “offsetting” assumptions mask the full impact of their important changes.
The Trustees’ most significant improvement is a long-overdue recognition that the fertility rate is not likely to rebound, which means fewer workers paying payroll taxes and thus, lower revenues. The Report also recognized that lower levels of temporary/unlawful immigration will mean a smaller workforce and lower payroll taxes, and that the One Big Beautiful Bill Act, which permanently lowered income tax revenues on Social Security benefits, further lowered revenues. These lower revenues are the main reason that Social Security’s projected 75-year deficit rose to 4.42 percent of taxable payroll, compared to 3.82 percent in 2025.
As expected, the projected depletion date for the Old-Age and Survivors Insurance (OASI) trust fund moved from 2033 to 2032, at which time the program will be able to pay only 78 percent of scheduled retirement benefits. Yes, the Disability Insurance (DI) trust fund has enough to pay benefits for the full 75-year period, so the date of depletion for the combined OASDI trust funds is 2034. But combining the two systems would require a change in the law; hence, under current law, the action-forcing date is 2032 – six years from now.
This brief provides more detail on the numbers for 2026, focusing particularly on the changes from last year’s Report. Despite the changes in assumptions, the bottom line remains the same. Americans enthusiastically support the Social Security program; their representatives should fix its finances. Fixing Social Security sooner rather than later would keep more options open, distribute the burden more equitably across cohorts, and most importantly, restore confidence in the nation’s major retirement program.
The 2025 Report
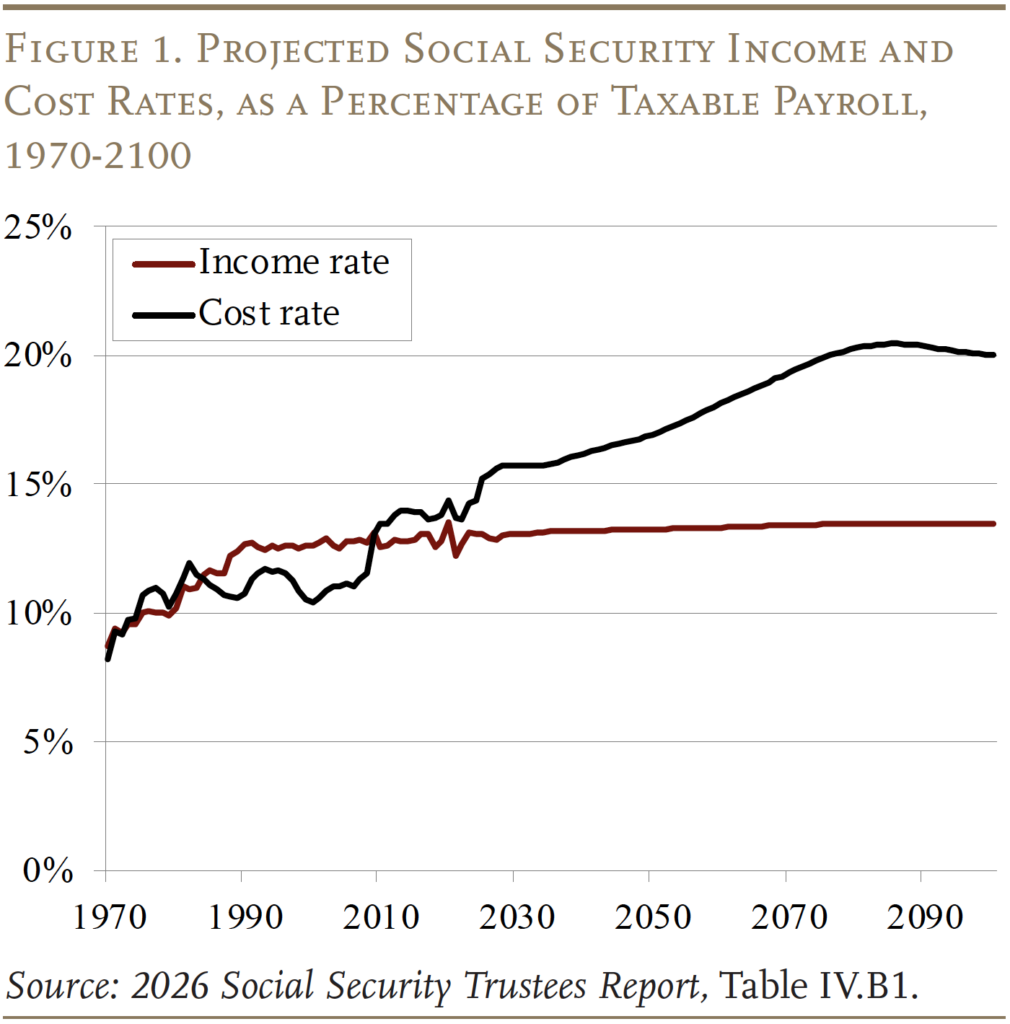
Under the Trustees’ intermediate assumptions, the cost of the OASDI program rises rapidly from 15.4 percent of taxable payrolls today to 16.2 percent in 2040, drifts up to about 20.5 percent in 2085, and then declines slightly (see Figure 1).
The increase in costs is driven by demographics, specifically the drop in the total fertility rate after the Baby Boom. Women of childbearing age in 1964 had an average of 3.2 children; by 1974, that number had dropped to 1.8. The combined effects of the retirement of the large Baby Boomer cohort and a slow-growing labor force (due to the drop in births) reduced the ratio of workers to retirees and raised costs. The gap between the income and cost rates measures the program’s annual deficit.
In the short term, the annual cash flow deficits are being offset by the assets in the trust fund, which currently equal about 150 percent of annual costs. These assets are the result of annual surpluses that emerged from reforms enacted in 1983. As noted in the introduction, these drawdowns will come to an end for OASI in 2032 when the trust fund is depleted.
It is crucial to emphasize that the depletion of the trust fund in 2032 does not mean that OASI has run out of money. At the time of the depletion, payroll tax revenues keep rolling in and can cover 78 percent of currently legislated benefits, declining to 62 percent in 2100, the end of the projection period. (If the OASI and DI trust funds were merged, the comparable numbers would be 83 percent, declining to 65 percent.)
Relying only on current tax revenues, however, means that the replacement rate – retirement benefits relative to pre-retirement earnings – for the typical age-65 retiree would drop immediately from about 36 percent to about 29 percent (see Figure 2). (Note that the replacement rate for those claiming at 65 has already declined due to the rise in the Full Retirement Age from 65 to 67.)
Moving from annual cash flows to the 75-year deficit requires calculating the difference between the present discounted value of scheduled benefits and the present discounted value of future revenues plus the assets in the trust fund. This calculation for the OASDI program shows that Social Security’s long-run deficit is projected to equal 4.42 percent of covered payroll earnings. That figure means that if payroll taxes were raised immediately by 4.42 percentage points – 2.21 percentage points each for the employee and the employer – the government could pay full scheduled benefits through 2100, with a one-year reserve at the end.
At this point, solving the 75-year funding gap is not the end of the story in terms of required tax increases. In the future, once the ratio of retirees to workers stabilizes and costs remain relatively constant as a percentage of payroll, any solution that solves the problem for 75 years will more or less solve the problem permanently. But, during this period of transition, any package of policy changes that restores balance only for the next 75 years will show a 75-year deficit in the following year as the projection period picks up a year with a large negative balance. Thus, eliminating today’s 75-year shortfall should be viewed as the first step toward “sustainable solvency.”
Some commentators cite Social Security’s financial shortfall over the next 75 years in terms of dollars – $30.5 trillion (see Table 1). Although this number appears very large, the economy – and, therefore, taxable payrolls – will also be growing. Thus, the scary $30.5 trillion can be eliminated – and a one-year reserve created – simply by raising the payroll tax by 4.42 percentage points.
The Trustees also report Social Security’s shortfall as a percentage of GDP. The cost of the program is projected to rise from about 5.3 percent of GDP today to about 6.8 percent of GDP as the Baby Boomers move through retirement (see Figure 3). The reason why costs as a percentage of taxable payroll keep rising – while costs as a percentage of GDP more or less stabilize – is that taxable payroll is projected to decline as a share of total compensation due to continued growth in health benefits.
2026 Report in Perspective
The 75-year deficits in the last two Trustees Reports are the largest since 1983 when Congress enacted major legislation to restore balance (see Figure 4). Two important questions are: Why did the deficit grow over the period 1983-2026? And why did it increase since last year’s Report?
Changes in 75-Year Deficit Since 1983
Social Security moved from a projected 75-year actuarial surplus of 0.02 percent of taxable payroll in the 1983 Trustees Report to a projected deficit of 4.42 percent in 2026. As shown in Table 2, leading the list of reasons is advancing the valuation period. Each time it moves out one year, it picks up a year with a large negative balance. The cumulative effect over the last 43 years has been to increase the 75-year deficit by 2.51 percent of taxable payrolls. That is, more than half of the 43-year change in the OASDI deficit is attributable to simply moving the valuation period forward.
The second most important contributor to the increase in the 75-year deficit over the last 43 years has been the worsening of economic assumptions – primarily a decline in assumed productivity growth and the impact of the Great Recession. Following the economic factors, changing demographic assumptions – most particularly, the recent reductions in the assumed fertility rate – contributed about half a percentage point to the increase in the deficit. Finally, increases in disability rolls contributed to the 43-year change, although that picture has changed dramatically in recent years. Partially offsetting the negative factors has been a reduction in the actuarial deficit due to methodological improvements and updated data. The net effect in 2026 of all these changes is a 75-year deficit equal to 4.42 percent of taxable payrolls.
The Narrowing Window
The 2026 Trustees Report shows that Congress has only six years to act to avoid a 22-percent cut in retirement benefits (see Figure 5). If the law is changed so that Social Security’s OASI and DI trust funds are combined, reserves will be adequate to pay full benefits until 2034. As noted, to remain solvent with a one-year reserve, the payroll tax rate would have to be increased immediately by 4.42 percentage points. Alternatively, scheduled benefits would have to be reduced immediately by 22 percent, with the cut rising gradually to 38 percent by 2100. A politically acceptable solution would likely involve some combination of revenue increases and benefit cuts.
All these estimates, however, are based on the Trustees’ intermediate assumptions, and these assumptions have changed sharply between the 2025 and 2026 Reports.
Changes from Last Year’s Report
The deficit of 4.42 percent of taxable payrolls in the 2026 Report is considerably higher than the 3.82 percent in last year’s Report – 0.60 percent of taxable payrolls. The main reason for the increase is that the new projections include three changes that sharply reduce future revenues: a significant reduction in the fertility-rate assumption, lower assumed levels of temporary and unlawful immigration, and a reduction in income tax revenues from taxing Social Security benefits under the One Big Beautiful Bill Act (OBBBA). These three changes plus moving the valuation period and changing the methodology, which reduce the actuarial balance by 0.81 percent, are partially offset by two significant – and somewhat surprising – positive changes in assumptions: increased productivity and higher mortality rates.
Changes in Assumptions that Reduce Social Security’s Actuarial Balance
As shown in Table 3, three main changes – fertility, immigration, and the effect of the OBBBA – more than explain the increase in the 75-year change. These big changes are accompanied by the effect of moving forward the valuation period and by some minor changes in methodology.
Fertility. The headline from the 2026 Trustees Report is the reduction in the fertility-rate assumption from an ultimate 1.90 children per woman to 1.75 per woman. U.S. fertility rates have generally been falling since the end of the Baby Boom in the mid-1960s, and that decline accelerated after the Great Recession (see Figure 6). Many observers thought that, once the economy recovered, the fertility rate would rebound. It has not. Today, the hypothetical lifetime number of births for a woman over her childbearing years is 1.59, even below the new fertility assumption.
The Social Security Trustees have been well aware of these numbers, but have been hesitant to change their assumption.1 This large reduction in the assumption about the ultimate fertility rate is welcome news. Unfortunately, this change to the new ultimate rate of 1.75 children, which is achieved by 2050, decreases the actuarial balance by 0.33 percent of taxable payroll. In addition, birth data for 2024 and 2025 indicate that fertility rates were lower than those used in last year’s result. Incorporating the updated data further increases the 2026 deficit by 0.02 percent of taxable payrolls.
The question remains whether the Trustees have reduced the fertility-rate assumption enough. If the U.S. rates follow those in other developed countries, some further reduction in the assumption may be necessary (see Figure 7).
Indeed, the Trustees’ projected fertility rate is still higher than that of other government agencies. The Congressional Budget Office, in its January 2026 projections, assumes that the total fertility rate will drop to 1.53 in 2035 and remain fairly stable thereafter.2 In the Census Bureau’s 2023 projections, the total fertility rate decreases linearly from 1.64 children per woman in 2023 to 1.55 in 2100. These numbers also suggest that some further adjustments to the Trustees’ rates may be needed going forward.
Immigration. While the adjustment to the fertility-rate assumption reflects the mounting evidence that the rate was unlikely to rebound, the adjustments on the immigration side reflect the effects of the Trump Administration’s hostility to immigrants. Social Security’s immigration projections involve estimating net flows for two types of immigrants – lawful permanent residents and those present temporarily or unlawfully.
The biggest change in the 2026 Trustees Report is a reduction in the assumption regarding the ultimate level of temporary or unlawfully present immigrants entering the country from 1,350,000 assumed for last year’s report to 1,200,000 per year. This change in the ultimate level decreases the actuarial balance by 0.12 percent of taxable payroll.
The 2026 Report also includes three further immigration-related adjustments. Specifically, the Trustees:
- Decrease the estimated levels of temporary or unlawfully present immigrant entrants for calendar years 2022-2025, based on updated data. The lower levels decrease the actuarial balance by 0.04 percent of taxable payroll.
- Increase the assumption regarding emigration rates from the unlawfully present population for the years 2025-2030 to reflect the Trump Administration’s more restrictive policies. This change decreases the actuarial balance by 0.05 percent of payroll.
- Incorporate updated data for lawful immigration and some other items, which increases the actuarial balance by 0.03 percent of taxable payroll.3
In total, immigration-related changes decreased Social Security’s actuarial balance by 0.18 percent of taxable wages.
The One Big Beautiful Bill Act (OBBBA). This law makes permanent the tax rates and tax brackets originally enacted under the 2017 Tax Cuts and Jobs Act. It also increases and makes permanent the larger standard deduction included in the 2017 Act. Finally, the legislation adds a temporary additional standard deduction for taxpayers over age 65. These changes reduce taxable income for many Social Security beneficiaries, so retirees will pay less income tax on their Social Security benefits, and the Trust Funds will receive lower revenue than had been anticipated from the income taxation of these benefits. The overall effect of this law change is a decrease in the OASDI actuarial balance of 0.16 percent of taxable payroll.
Changes in Assumptions that Increase Social Security’s Actuarial Balance
The two major changes in the 2026 Trustees Report that improve the Social Security actuarial balance are: 1) an improvement on the economic side from rising productivity, which raises earnings and thereby revenues; and 2) a big increase in mortality, which means that retirees are not going to receive benefits for as many years as assumed in last year’s Report (see Table 4). Unfortunately, the case for neither change is very persuasive.
Increased Productivity and Earnings. The 2026 Report and the attached description of the thinking behind the economic assumptions emphasize that the ultimate economic assumptions remain unchanged. The more detailed write-up presents arguments for and against an uptick in productivity growth, remaining neutral about the future. The same write-up concludes it is too early to know how AI will affect productivity.
Yet, the Trustees decided that the average growth rate for productivity from 2025 to 2035 will be 1.62 percent, 0.05 percentage points above the rate assumed over that period in last year’s Report. As a point of comparison, the Congressional Budget Office, in its Long-Term Budget Outlook: 2026 to 2056, projects that total-economy productivity would grow at an average rate of 1.3 percent over the period 2026 to 2036.
More productivity growth leads to higher wages and, therefore, more revenues. The estimate is that this change will increase Social Security’s actuarial balance by a meaningful 0.10 percent of taxable payrolls.
Higher Mortality. That mortality assumptions would be important is intuitive, since the longer people live – given the current Full Retirement Age – the more expensive the program. The Trustees contend that an updated approach and updated data suggest higher death rates for all future years than were projected in last year’s Report.
Mortality rates are very complicated to project, and different researchers use a variety of approaches, so the easiest way to assess the reasonableness of the Trustees’ new assumption is to compare projections across agencies. In 2026, the Congressional Budget Office’s mortality assumptions result in life expectancy at birth of 82.3 years in 2056 – the end of their projection period. In the Census 2023 projections, the assumed mortality rates result in a life expectancy at birth of 83.8 years in 2056. In contrast, the Trustees’ assumptions result in a life expectancy at birth of 81.8 years in 2056. This comparison shows that the increase in mortality rates in the 2026 Report moves Social Security even further away from other agencies than it was last year (see Table 5).
Moreover, comparisons with other developed countries also suggest substantial room for a major improvement in U.S. life expectancy (see Figure 8). Life expectancy at birth in the United States and other high-income countries has increased dramatically over the last 40 years. But progress in the United States has been slower than its peers, and the U.S. ranking has dropped from the middle of the group to the absolute bottom. Historically, two contributors to this poor performance have been deaths linked to smoking and obesity.4 Smoking has faded as an issue, but obesity remains important. To the extent that the GPL-1 weight loss drugs become more widely available, the United States might regain its position among other developed nations.5
Even though the change in the Trustees’ mortality assumptions are not persuasive, they improve Social Security’s actuarial balance by 0.09 percent in the 2026 Report.
Summary
Figure 9 compares the annual balances for this 2026 Trustees Report with last year’s Report. Compared to last year, this year’s balances are lower in the short term, higher in 2031-2047, and then lower for the rest of the projection period. The immediate decline reflects the loss of income tax revenues due to the OBBBA and the near-term immigration assumptions. Balances then trend higher due to the improvement in productivity growth and earnings from 2025 to 2035. After that, balances in this Report are lower than last year as the decline in fertility and lower immigration take effect. Importantly, the projected annual deficit in 2100 is 6.57 percent of taxable payroll in this report, compared to 4.86 percent in last year’s Report. Of course, the pattern and endpoint will look worse if the assumed increase in productivity growth and higher mortality rates are not realized. On the other hand, the picture could look better if the nation encourages legal immigration.
Conclusion
The 2026 Trustees Report takes us much closer to having a realistic measure of Social Security’s shortfall. Unfortunately, the Trustees mask the full impact of lower fertility and less immigration with unreasonable assumptions about productivity growth and mortality rates. Policymakers must have confidence in the size of Social Security’s shortfall so that they believe that the changes they make will solve the problem. Defining the shortfall was the first step taken by the so-called Greenspan Commission when it began its deliberations to fix Social Security in 1982.
Despite the larger deficit, the 2026 Trustees Report confirms what has been evident for almost three decades – namely, Social Security is facing a long-term financing shortfall and needs to be fixed. Even with a deficit that equals about 1.5 percent of GDP, the changes required to fix the system are well within the bounds of fluctuations in spending on other programs in the past. Moreover, action needs to be taken quickly, before the OASI trust fund is depleted and benefits are cut in 2032. Numerous options are available on both the revenue and benefit sides to close the gap. All that is needed is the political will.
References
Burkhalter, Kyle and Karen Rose. 2024-2026. “Replacement Rates for Hypothetical Retired Workers.” Actuarial Note Number 9. Baltimore, MD: U.S. Social Security Administration.
Burkhalter, Kyle and Chris Chaplain. 2023. “Replacement Rates for Hypothetical Retired Workers.” Actuarial Note Number 9. Baltimore, MD: U.S. Social Security Administration.
Centers for Disease Control and Prevention, National Vital Statistics System. 2026. “Birth: Provisional Data for 2025.” Report No. 43. Atlanta, GA.
Chen, Anqi, Alicia H. Munnell, Geoffrey T. Sanzenbacher, and Alice Zulkarnain. 2017. “Why Has U.S. Life Expectancy Fallen Below Other Countries?” Issue in Brief 17-22. Chestnut Hill, MA: Center for Retirement Research at Boston College.
Clingman, Michael, Kyle Burkhalter, and Chris Chaplain. 2014-2022. “Replacement Rates for Hypothetical Retired Workers.” Actuarial Note Number 9. Baltimore, MD: U.S. Social Security Administration.
Congressional Budget Office. 2026a. The Demographic Outlook: 2026 to 2056. Washington, DC.
Congressional Budget Office. 2026b. Long-Term Budget Outlook: 2026 to 2056. Washington, DC.
Congressional Budget Office. 2025. The Demographic Outlook: 2025 to 2055. Washington, DC.
Desilver, Drew. 2024. “As Obesity Rates Rise in the U.S. and Worldwide, New Weight-Loss Drugs Surge in Popularity.” Short Reads. Washington, DC: Pew Research Center.
U.S. Census Bureau. 2025. 2023 National Population Projections Datasets. Washington, DC.
U.S. Social Security Administration. 1983-2026. The Annual Reports of the Board of Trustees of the Federal Old-Age and Survivors Insurance and Federal Disability Insurance Trust Funds. Washington, DC: U.S. Government Printing Office.
U.S. Social Security Administration. 2004. “A Stochastic Model of the Long-Range Financial Status of the OASDI Program.” Actuarial Study No. 117. Baltimore, MD: Office of the Chief Actuary.
World Bank. 2026a. “World Development Indicators: Fertility Rate, Total (Births per Woman).” Washington, DC.
World Bank. 2026b. “World Development Indicators: Life Expectancy at Birth, Total (Years).” Washington, DC.
Endnotes
- In 2024, the Trustees also reduced the ultimate fertility rate, but only from 2.0 children to 1.9 children. The Trustees based their case for a cautious approach on two factors. The first was that repeated surveys of women of childbearing age show birth expectations above 2.0, suggesting that the current low levels would not be permanent. Second, they believed that increasing fertility rates for women in their 30s supported the notion that women are simply postponing their childbearing. ︎
- Congressional Budget Office (2026a).
 ︎
︎ - It is unclear how much of the 0.03 percent increase in the actuarial balance is due to updated data for legal immigration as opposed to the other items cited – population, marriage, and divorce. Reclassifying this relatively small factor would not affect the argument. ︎
- See Chen et al. (2017). ︎
- Desilver (2024). ︎
Popular Products
-
 Adjustable Shower Chair Seat
$107.56$53.78 -
 Adjustable Laptop Desk
$91.56$45.78 -
 Sunset Lake Landscape Canvas Print
$225.56$112.78 -
 Adjustable Plug-in LED Night Light
$61.56$30.78 -
 Portable Alloy Stringing Clamp for Ra...
$119.56$59.78