What's Happening In The Bond Market Right Now (and Should You Adjust Your Portfolio?)
The bond market is taking up a space it rarely occupies: the center of attention.
On October 1, the 30-year Treasury bond's yield reached 5.693% – its highest intraday level since 2002. The 10-year eclipsed 5.3% for the first time since 2002. Shorter-term yields have also picked up steam.
The rise in interest rates across the board is having widespread impacts. Sure, it's pushing up the annual percentage yields (APYs) on savings accounts, certificates of deposit (CDs) and money market accounts (MMAs). But it's also elevating the rates we pay for mortgages — 30-year home loans are back above 7% and at multiyear highs — auto loans, credit cards and more.
Investors are feeling it, too. It's making borrowing much more expensive for corporations, which threatens to take the wind out of the stock market's sails. And the broad-spectrum ascent in rates is kneecapping bonds of virtually all maturities. (Remember: Bond prices and yields move in opposite directions.)
So, what's going on? If you quickly answered "the Federal Reserve," you're right … but you only get partial credit. There's more to it, and the Fed didn't cook up its recent rate hike on a whim.
Read on as we discuss why the bond market is so, ahem, lively of late, and whether investors should do anything with their portfolios in response.
The Fed's big splash
The Federal Open Market Committee (FOMC) made the single biggest rate-related headline on September 16, when it did what Wall Street largely anticipated: It raised its federal funds rate target range by a quarter point, to 3.75%-4.00%.
The first such increase since 2023 was ushered in by a unanimous vote — a big departure from the Fed's July meeting, where America's central bank held rates steady by a 9-3 vote.
What wasn't as universally expected was the Fed's thoughts on future rates.
Here's what David Payne, staff economist and reporter for The Kiplinger Letter, reported on the updated Summary of Economic Projections released alongside September's statement:
"The committee's economic projections show slightly higher GDP and inflation rates than what we saw in June. The FOMC also expects two additional rate hikes: one more this year, and one in 2027, before the federal funds rate starts coming down with an expected decline in inflation.
In the long run, the committee expects the federal funds rate to be between 3.0% and 4.0%, with PCE inflation reaching 2.0% by 2029. In June, the FOMC expected PCE to fall to 2.0% by 2028."
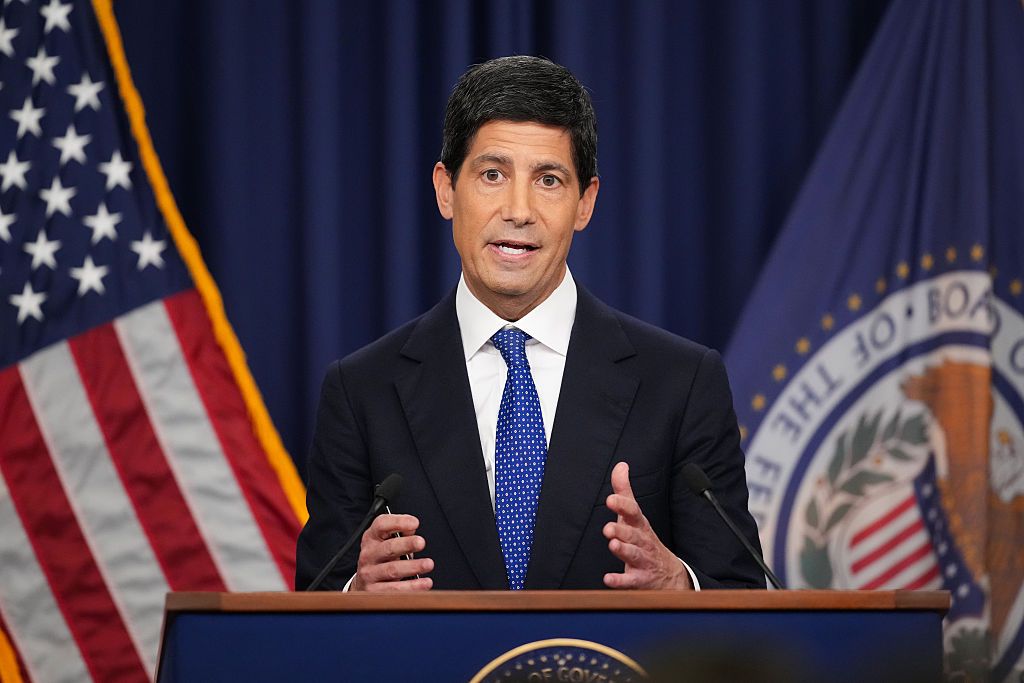
In his post-meeting press conference at the September Fed meeting, Chair Kevin Warsh pointed to economic strength, persistent inflation and geopolitical tensions. "All three of those things lend themselves to a firm, unanimous decision today," he said.
That explains short-term rates, but …
The federal funds rate is the interest rate at which commercial banks lend reserves to each other overnight. It's a short-term rate, in other words, and it has the most impact on shorter-term accounts, including savings, CDs and MMAs.
The "prime rate" — the rate that banks charge customers with the best credit — is also strongly tied to the federal funds rate. Debt such as credit cards, personal loans and small business loans is usually set as the prime rate plus a margin that varies by your creditworthiness.
The federal funds rate can eventually bleed into longer-term interest rates, which affect student loan and mortgage rates, but it's not as strong a connection.
The Fed's most direct way of impacting longer-term rates is through "quantitative easing" (QE, which is the buying or selling of longer-maturity bonds). But as our Charles Sizemore points out, "Warsh has said reducing the size of the Fed's balance sheet is another priority, in support of his long-term monetary policy. So no significant bond-buying is expected this year."
Those expectations, as well as worries about high energy prices keeping inflation elevated, are likelier culprits for the selloff in longer-dated bonds (and the associated jump in their yields).
"Chair Warsh's hawkish messaging and explicit indication that the Fed would not ‘look-through' higher energy prices, without any guidance that this hiking cycle might be shallower than previous history would suggest, have left markets free to price-in more hawkish policy paths," says Andrew Hollenhorst (PDF), U.S. chief economist for Citi Research. "It should not be surprising that this has led to both higher shorter-term and longer-term yields."
Some of the recent action reflects simple supply and demand for bonds themselves: Across the globe, governments are issuing more debt, and a wave of corporate bond issuance tied to artificial intelligence (AI) data center buildouts is adding to the pile competing for investor capital. That's pushing prices down (and yields up) independent of anything the Fed does.
We're also not the only developed country with higher yields on our sovereign debt. Germany's 10-year yield has climbed back to levels last seen in 2008. French 10-year yields haven't been this high since 2008, either. Japan's 10-year has been constantly rising; in September, it cleared the 3% mark for the first time since the late 1990s.
Wall Street isn't sure what comes next
Strategists don't agree on how much further this goes, which is worth keeping in mind before making any big moves.
Deutsche Bank analysts called the dot plot's hawkish shift the start of "a modest hiking cycle," but noted Warsh's framing — emphasizing the need to tighten financial conditions broadly, rather than characterizing the move as risk management — left the ultimate size of further hikes more open-ended than it needed to be.
Citi's Hollenhorst says there's plenty to suggest that economic data will cool, but that might not be a quick salve.
"Base effects alone mean there is a low bar for year-on-year inflation readings to continue to cool," he says. "And given the (in our view) encouraging underlying trend, core measures should also continue to come in cooler in coming months. Even accounting for ‘residual seasonality' in January and February, we think inflation will have cooled sufficiently to have the Fed cutting in mid-2027.
But that story will take months to play out in the data. The only near-term driver of more dovish pricing would be a slowing in economic growth."
Byron Anderson, head of fixed income at Laffer Tengler Investments, told us that the Fed had "no choice" but to hike, and that the alternative was a much bigger bond-market selloff. However, "a single rate cut is not going to placate this bond market for long and will not solve inflation. An Iran solution would be much better than rate hikes, but alas."
What this means for your portfolio
Should you, as an investor, do anything different in this current environment?
Our advice is typically to stick to your plan — market timing rarely goes well for anyone, let alone retail investors. But if you do prefer to tinker a bit, here are some thoughts:
- Don't abandon fixed income, but shorten your timeline: Yields on bonds maturing in 10 years or less (so, intermediate- and short-term debt) are attractive, and these issues carry much less interest-rate risk than longer-dated bonds. You could also consider laddering — spreading maturities across several years – to lock in today's higher yields at multiple points without betting the whole position on which way rates move next. If you prefer funds to individual bonds, consider top bond fund picks: Vanguard Short-Term Corporate Bond Index Fund (VSCSX, 5.2% SEC 30-day yield, 0.06% expenses) or State Street SPDR Portfolio Intermediate Term Treasury ETF (SPTI, 4.9% SEC 30-day yield, 0.03% expenses).
- Don't let your cash sit in cash. Even money market funds are paying in the high-3% zone right now. So make sure you're maximizing any idle cash in your account. Vanguard Treasury Money Market Fund (VUSXX, 0.07% expenses) pays 3.8% as I write this.
- Bank stocks look better in this environment. "Financials will benefit from their ability to ask more for the money they lend vs what they spend for the money they borrow, thus boosting net interest income," Sizemore writes. The State Street SPDR S&P Bank ETF (KBE, 0.35% expenses) is a more direct play on bank stocks than its sister fund, the State Street Financial Select Sector SPDR ETF (XLF, 0.08% expenses).
- Energy stocks generally do better, too. It's less about rates themselves, and more about what's driving them. Inflation reduces the value of the U.S. dollar, so energy commodities priced in dollars benefit. Also, strong economies usually produce higher demand for oil and gas. But focus on energy producers, who are the likeliest to benefit. As far as energy ETFs go, consider the iShares U.S. Oil & Gas Exploration & Production ETF (IEO), which owns the likes of ConocoPhillips (COP) and Valero Energy (VLO) and charges 0.37% annually.
- And dividend growers can act defensively. Dividend growth stocks are generally considered all-weather holdings given relatively high financial quality compared to their peers. But rising dividends also look a lot better than static dividends in the face of rising yields. You can diversify with dividend growth ETFs like the ProShares S&P 500 Aristocrats ETF (NOBL, 0.35%).
Related Content
Popular Products
-
 Electronic String Tension Calibrator ...
$41.56$20.78 -
 Pickleball Paddle Case Hard Shell Rac...
$27.56$13.78 -
 Beach Tennis Racket Head Tape Protect...
$59.56$29.78 -
 Glow-in-the-Dark Outdoor Pickleball B...
$49.56$24.78 -
 Tennis Racket Lead Tape - 20Pcs
$51.56$25.78