Real Estate Brokerage Retention And Recruiting Hinge On Pipeline Timing
Every brokerage leader has experienced the same frustration. An agent leaves, and only afterward, does the pattern of agent retention risk become obvious. The listings had closed. Nothing new was coming in. The conversations became less frequent. Then the resignation came.
That instinct is measurable. We measured it.
How we tested it
Most movement analyses are inherently backward-looking. They identify the agents who left and then analyze them after the move has already happened. The problem is that once an agent changes brokerages, it’s difficult to tell which characteristics led to the move and which were simply the result of it.
We approached the problem differently.
We identified every agent in our MLS coverage areas who closed at least one transaction during a 12-month period, more than 625,000 agents, and captured a snapshot of each one on a single date. For every agent, we recorded only two variables: the number of days since their most recent closing and the number of active listings they had at that moment.
We then followed those same agents over the next 12 months to answer one question: when they closed their next transaction, was it with the same brokerage or a different one?
There were no surveys, interviews or self-reported data, and no retrospective analysis. We measured each agent’s position at a fixed point in time and observed what happened next.
The study also includes every producing agent in the market, not just high-volume producers. One-deal and two-deal agents, who are often excluded from industry research, remained in the dataset. If an agent closed at least one transaction during the observation period, they were included.
The anchor effect
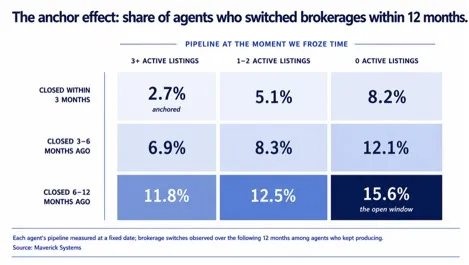
Here is what that forward test found:
Among agents who had closed within the previous three months and had three or more active listings, only 2.7% changed brokerages over the following year. At the other extreme, agents who had gone at least six months without a closing and had no active listings switched at a rate of 15.6%, nearly six times higher.
The pattern is remarkably consistent. Switching risk rises with every additional month since an agent’s last closing and falls with every additional listing in their pipeline. There isn’t a single reversal anywhere in the grid. The signal doesn’t simply exist, it compounds across both dimensions.
The implication is important. The agent in the upper-left corner of the chart is not necessarily happier, more loyal or better supported than the agent in the lower-right corner. They’re simply more invested in staying put. Active listings, pending transactions, future commission income, and a full pipeline all increase the cost of changing brokerages. As that pipeline shrinks, so does the cost of leaving.
That shifts the conversation from loyalty to timing.
Brokerages often ask, “Which agents are thinking about leaving?” A better question is, “Which agents are becoming free to leave?”
It’s strongest exactly where owners feel safest
The pattern doesn’t weaken among top producers. If anything, it becomes more pronounced.
Among agents closing 12 or more transactions annually, those with a recent closing and three or more active listings switched brokerages at a rate of just 2.3%. Those same high producers who had gone at least six months without a closing and had no active listings switched at 17.4%, more than seven times as often.
The same relationship appears across every production tier. Mid-producing agents ranged from 3.1% to 13.4%, while lower-volume producers ranged from 4.0% to 14.2%. Regardless of production level, the condition of an agent’s pipeline remained one of the strongest indicators of future brokerage movement.
This challenges one of the industry’s most common assumptions. High producers are not inherently more loyal than everyone else. They’re simply less likely to experience an empty pipeline. When they do, their behavior begins to resemble everyone else’s.
That moment matters disproportionately. Losing a top producer means losing a significant book of business, making early detection far more valuable than retrospective analysis.
The implication extends beyond agent retention risk. The same signal identifies both the agents most at risk of leaving your brokerage and the agents most likely to be receptive if they’re at a competing firm. Recruiting and retention are not separate problems. They’re the same signal viewed from opposite sides of the market.
The signal everyone misreads
Conventional wisdom says that agents become vulnerable after listings fall apart. Ask most brokers what signals an agent may be preparing to leave, and they’ll point to withdrawals, cancellations, or expired listings.
The data tells a different story.
We tested whether failed listings predicted brokerage movement by examining status-change records for every canceled, withdrawn, and expired listing before the observation date. Across every level of pipeline activity, agents who had experienced listing failures were less likely to change brokerages than agents with no failed listings at all.
Among agents with no active listings, 9.7% of those with no cancellations switched brokerages, compared with 8.0% of those who had experienced two or more cancellations.
The same pattern held among agents with three or more active listings, where switching fell from 5.3% to 1.3%. Even a cluster of cancellations immediately before the observation date showed no meaningful increase in future brokerage movement.
The finding makes sense in hindsight. A canceled listing is still evidence that an agent secured a listing in the first place. It reflects business activity, even if the outcome was unsuccessful. The greater risk is not failure, it’s inactivity.
The agents most likely to leave are not those whose deals are falling apart. They are the ones who have stopped generating opportunities altogether.
Silence, not failure, is the departure signal.
Who moves: The career clock
Pipeline state tells you when the window opens. Tenure tells you who tends to be standing near it.
Experience follows a different pattern than pipeline.
First-year agents are the most likely to change brokerages, switching at a rate 63% above the market average. Movement then declines steadily with each additional year in the business until approximately year five, when it rises sharply before resuming its downward trend. By year ten, agents are roughly 40% less likely than average to switch.
The year-five increase stands out because it interrupts an otherwise consistent decline. Something changes at that point in an agent’s career.
By year five, these are no longer new licensees experimenting with the business. They have survived the industry’s highest attrition years, built meaningful production, and established a client base. Yet they become measurably more likely to reconsider their brokerage relationship than the surrounding experience cohorts.
Whatever drives that reassessment, it represents an important retention window. Brokerages that focus exclusively on onboarding new agents may overlook one of the most significant transition points in an established producer’s career.
Headcount and dollars tell different stories
Viewed by headcount, brokerage movement is overwhelmingly a small- and mid-producer phenomenon. Nearly half of all agents who were an agent retention risk and who changed brokerages had produced less than $1 million in the prior twelve months, and more than 85% had produced under $4 million.
Viewed by production volume, however, the picture changes completely.
Agents producing more than $8 million represented just 5% of all movers, yet accounted for approximately 37% of the total production volume that changed brokerages. Agents above $4 million made up only one in seven movers but represented nearly 60% of the production that moved.
Most movers are small. Most moved dollars are not.
The distinction matters because recruiting strategies often optimize for only one of those realities. Focusing exclusively on volume means competing for the same small pool of established producers everyone else is pursuing. Focusing exclusively on headcount captures plenty of movement, but relatively little production.
The more effective approach is to optimize for timing. A productive agent whose pipeline has gone quiet represents both meaningful opportunity and elevated switching risk. The production tier determines the size of the opportunity. The pipeline determines when it is most likely to move.
Putting the findings to work
Most brokerages approach recruiting and retention as periodic activities: quarterly recruiting initiatives, annual performance reviews, occasional coaching conversations. Implicitly, that assumes an agent’s likelihood of moving is relatively stable between those moments. The data suggests otherwise. Switching risk changes as an agent’s business changes, creating windows that can open and close within weeks.
The answer isn’t more hustle. It’s watching the right signals continuously:
For retention
Monitor your own roster for producers whose pipelines have gone quiet. An agent with no recent closing and no active listings is not simply having a slow quarter. They occupy one of the highest observed movement-risk profiles in the dataset.
For recruiting
Apply the same framework across the broader market. The highest-value recruiting opportunities are often not the loudest or most visible agents, but productive agents whose pipelines have recently emptied.
For leadership
Use data to augment agent retention risk and judgment rather than replace it. Experienced brokerage leaders often recognize subtle behavioral changes before they can explain them. Objective market signals make those observations consistent, measurable, and scalable.
The takeaway
Each year, brokerages can expect roughly 20% to 25% of their production volume to leave with departing agents. For decades, movement has largely been treated as an unavoidable consequence of the business.
This analysis suggests otherwise.
Across more than 625,000 producing agents, brokerage movement consistently followed observable patterns. An emptying pipeline increased switching risk. Career stage influenced when agents reconsidered their brokerage relationships. Contrary to conventional wisdom, inactivity proved to be a stronger signal than failed listings.
None of these indicators requires surveys, interviews, or speculation. They already exist in the production data brokerages collect every day.
The firms that consistently retain their best producers, and recruit the right ones from competitors, will not necessarily be those making the most calls. They will be the firms that recognize opportunity before everyone else does.
In brokerage recruiting and retention, timing is not a tactical advantage.
It is the advantage.
Methodology: Analysis of MLS records covering 625,000+ agents and across 32+ MLSs, conducted by Maverick Systems. The cohort includes every agent who closed at least one transaction in the twelve months before a fixed anchor date. Pipeline state (active listings, closing recency), tenure, and production were measured at the anchor; brokerage changes were observed over the following twelve months among agents who continued producing. Tenure movement is presented as an index (average producing agent = 100); production movement as shares of all switchers. Cancellation analysis uses listing status-change timestamps in the markets that report them. Tenure is measured from an agent’s first observable closing.
Diana Zaya is the founder and CEO of Maverick Systems, a real estate analytics company focused on brokerage recruiting, retention, and market intelligence.
This column does not necessarily reflect the opinion of HousingWire’s editorial department and its owners.
To contact the author of this story:
Diana Zaya at diana@mavericksystems.com
To contact the editor responsible for this story:
Tracey Velt at tracey@hwmedia.com
Popular Products
-
 Smart Bluetooth Aroma Diffuser
$585.56$292.87 -
 WiFi Smart Video Doorbell Camera with...
$61.56$30.78 -
 Wireless Waterproof Smart Doorbell wi...
$20.99$13.78 -
 Wireless Remote Button Pusher for Hom...
$65.99$45.78 -
 Digital Coffee Cup Warmer with Temp D...
$88.99$61.78