How The Polls Could Be Wrong Again
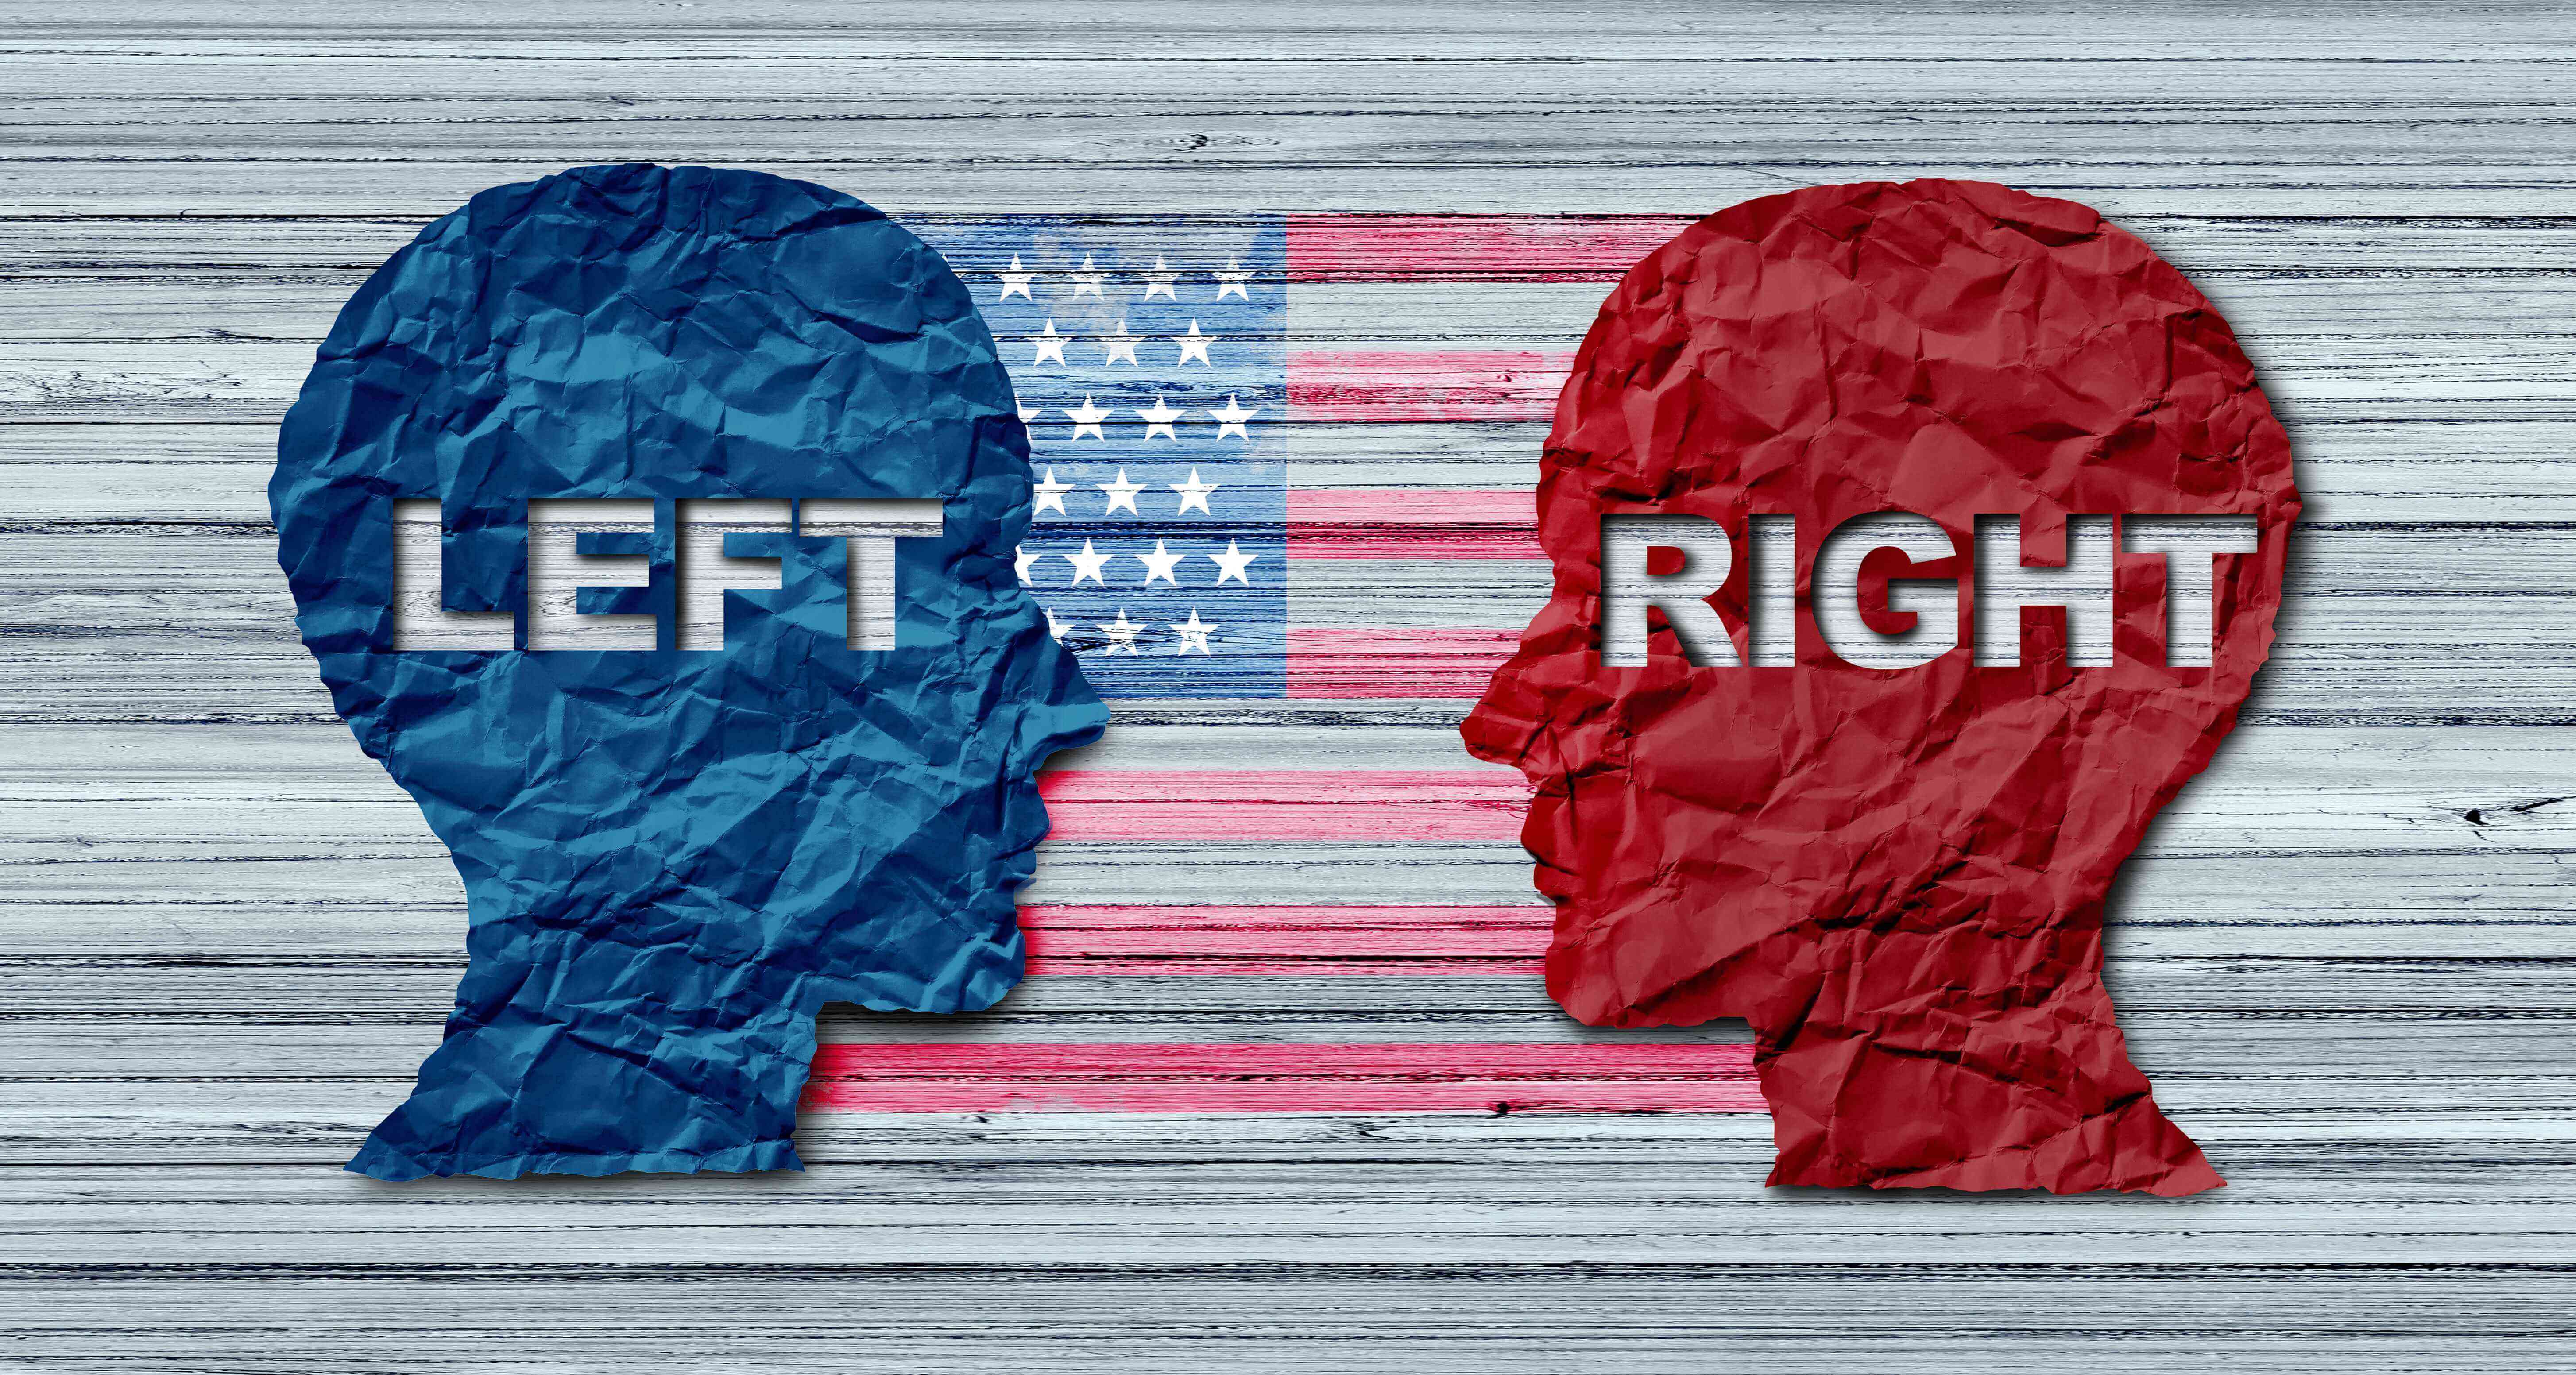
Less than a month out from Election Day, the polls are predicting a Democratic rout. According to the election forecaster Nate Silver’s polling average, Democratic Senate candidates are leading in Kansas, which voted for Donald Trump by 16 percentage points in 2024, as well as Alaska, Iowa, Ohio, and Texas, all of which Trump won by more than 10 points. In the House, Democrats are poised to win their largest majority in 18 years.
So the polls tell us. Can they be believed? Ever since underestimating Trump in 2016, pollsters have been busy trying to regain the public’s trust, tweaking their methodologies in ways both dramatic and subtle. Perhaps they’ve finally got it right. They seem to think so. “I’m confident that not just ourselves, but the industry, has good technique, good methodology, and that they are reflecting and representing public opinion,” Spencer Kimball, the director of polling at Emerson College, told me. But the industry has been confident before, only to be proved wrong.
After 2016, pollsters concluded that they had failed to pay enough attention to educational polarization, the somewhat-new phenomenon of college-educated voters having political preferences that were sharply different from those of voters without a degree. Going forward, the industry would try to include more non-college-educated voters in surveys or, if that proved impossible, would weight those voters’ responses to align with their share of the electorate. In 2018, the pollsters nailed the midterms with little error, suggesting that their adaptations had paid off.
Then came 2020. Although the polls correctly gauged that most people preferred Joe Biden to Trump, they underestimated Trump’s support by even more than they did in 2016, especially at the state level. The most memorable example was Wisconsin, where polls had Biden winning by up to 10 percentage points. He wound up winning by less than one.
These results left pollsters even more perplexed. If controlling for education didn’t work, what would? Perhaps, they figured, Trump supporters were just different from other voters: less likely to talk to pollsters than other demographically similar voters were. This phenomenon, known as partisan-nonresponse bias, would help explain why midterm polls in the Trump era have generally been more accurate than presidential-election polls: The midterm electorate skews toward politically engaged voters who are more trusting of institutions and more likely to have answered polls.
Moving forward, pollsters decided to reach for the bluntest object they had access to: “recalled vote.” If Trump supporters were systematically different, perhaps the best solution was just to ask, “Did you vote for Trump last time?” and then weight the sample so that it had the same Trump-voting percentage as the previous presidential election.
When 2022 rolled around, the pollsters once again nailed the midterm. But the recalled-vote tweak didn’t solve the problem in 2024, when polls underestimated Trump by about 3 percent, just as they had in 2016. In presidential years, at least, nonresponse bias had proved to be extremely difficult to correct for. Even among people who said they had voted for Trump, pollsters could seem to find only the ones who were most likely to vote for a Democrat.
[Marc Novicoff: Gas prices could cost Republicans the midterms]
“At some level, the respondents need to cooperate,” Patrick Ruffini, a Republican pollster, told me. “The individuals that you’re getting on the phone are the wrong people.” Robert Cahaly, the Republican pollster behind the Trafalgar Group, told me, “I’ve found that Republicans tend to be a little more concerned about: Is my name going to be on a list? They want to know, Who are you getting this information for?”
To deal with such an intractable problem, pollsters are resorting to ever more complex solutions. Douglas Rivers, the chief scientist at YouGov, told me that his team is now doing precinct-level modeling, making sure it has not just enough people who say they voted for Trump but also enough people who say they voted for Trump and live in neighborhoods that for the most part voted for Trump. The New York Times and Siena College have invented two new techniques for their jointly conducted polls, “support score” and “energy balancing,” which sound like healing crystals but are in fact statistical weights. They’re used to adjust survey data based on such factors as how Republican a respondent’s name sounds, what car they drive, and how many people in the electorate are demographically identical to them (as in, not just fellow Latinos but fellow young, Latino, agnostic conservatives who live in the suburbs).
Even if they manage to correct for nonresponse bias, pollsters have to nail the turnout model. Accurately predicting who’s voting for whom requires figuring out who’s voting at all. Turnout models can swing the results massively. For example, a September YouGov poll had Democrats leading by six percentage points in the U.S. House popular vote, enough for them to narrowly retake the lower chamber. But that was among registered voters. Among respondents whom YouGov deemed to be likely voters, the poll had Democrats winning by 16 points, an outcome that would likely usher in the largest Democratic majority in the House since the 1970s. Even Rivers, who runs YouGov’s American polling outfit, admits that that result is hard to believe. In a recent blog post, he wrote that it “comes from a mix of assumptions that all push the result in Democrats’ favor and that should probably be discounted.” (A newer YouGov poll published yesterday suggests a 10-to-12-point lead among likely voters, depending on the definition of likely.)
Turnout models involve a fair amount of informed guessing. Within the general population, the number of Black or white or Asian adults in America is knowable, and pollsters can thus make their samples representative in that sense. But predicting how any of those groups will turn out is always a judgment call. If turnout among certain groups winds up being much lower or much higher than the pollsters predict, that can increase the final error.
Democrats—and the polling industry—have a reason to be optimistic about 2026: It’s another midterm in which Trump is not on the ballot and the least engaged voters can be expected to stay home. That’s the kind of election that pollsters have recently gotten right. Then again, the sample size of Trump-era elections—two midterms and three presidential elections—is tiny. Voter behavior sometimes changes in unpredictable ways. And to whatever degree possible, Trump has managed to put himself on the ballot: hand-selecting most of the nominees, barnstorming the country, using taxpayer money to pay for political ads, and forcing his party to host a Trump-centric “midterm convention.”
A systematic polling error on the level of 2016 or 2024 would mean that Democrats fall short of Senate control. If the polls overestimate their chances by exactly three points in every state, then Democrats will barely win Alaska, Texas, Michigan, and Ohio, but they won’t pick up Kansas or Iowa or Maine, and they’ll lose Minnesota. The Senate would then be 50–50, Vice President Vance would be the tiebreaker, and dreams of a Democratic Senate would stay dreams. A 2020-level miss would be even worse for Democrats: They’d gain no Senate seats at all on net. Democrats would still take back the House, but much more narrowly.
Of course, these are hypotheticals. In reality, whatever polling errors materialize will vary from state to state. And if we could say in advance exactly how they’d vary, we wouldn’t need polls in the first place.
Popular Products
-
 Gas Detector Meter
$311.56$155.78 -
 Foldable Garbage Picker Grabber Tool
$93.56$46.78 -
 Portable Unisex Travel Urinal
$49.56$24.78 -
 Reusable Keychain Pepper Spray – 20ml
$21.56$10.78 -
 Camping Survival Tool Set
$41.56$20.78